Published December 18, 2024
November 2024 Central Texas Housing Market Report

AUSTIN,
Texas – In November across the Austin-Round Rock-San Marcos MSA, closed sales
ticked up 4.6% to 2,130 closed listings, indicating a positive sign for buyers
and sellers as the market continues to stabilize, according to the latest Central
Texas Housing Report released by Unlock MLS. The
growth in sales is reflective of September’s lower mortgage rates and
consistent sales activity earlier in the fall.
Clare
Knapp, Ph.D., housing
economist for Unlock MLS and the Austin Board of REALTORS®, noted that
November’s data reflects continued stability in Austin’s housing market.
“November’s
sales increase is largely tied to the activity we saw in September and October
when mortgage rates inched down to 6.08% and prospective buyers felt encouraged
to move towards buying a home. What’s driving behavior in the market is where
mortgage rates land. Moving forward, despite higher mortgage rates, sales
activity should remain relatively consistent year-over-year.
Kent
Redding, 2024 Unlock
MLS and ABoR president, highlighted the current momentum in the market,
emphasizing both the opportunities for buyers and sellers as the market
continues to stabilize heading into the new year.
“With
solid pending sales activity and steady inventory levels, Austin’s housing
market is positioned for a steady close to the year. Buyers who locked in lower
rates earlier this fall are now finalizing purchases, while sellers are finding
promising opportunities as the market stabilizes with the guidance of REALTORS®.
Whether you’re ready to build equity through homeownership or have your sights
set on a specific neighborhood, now is the time to act and make your move.”
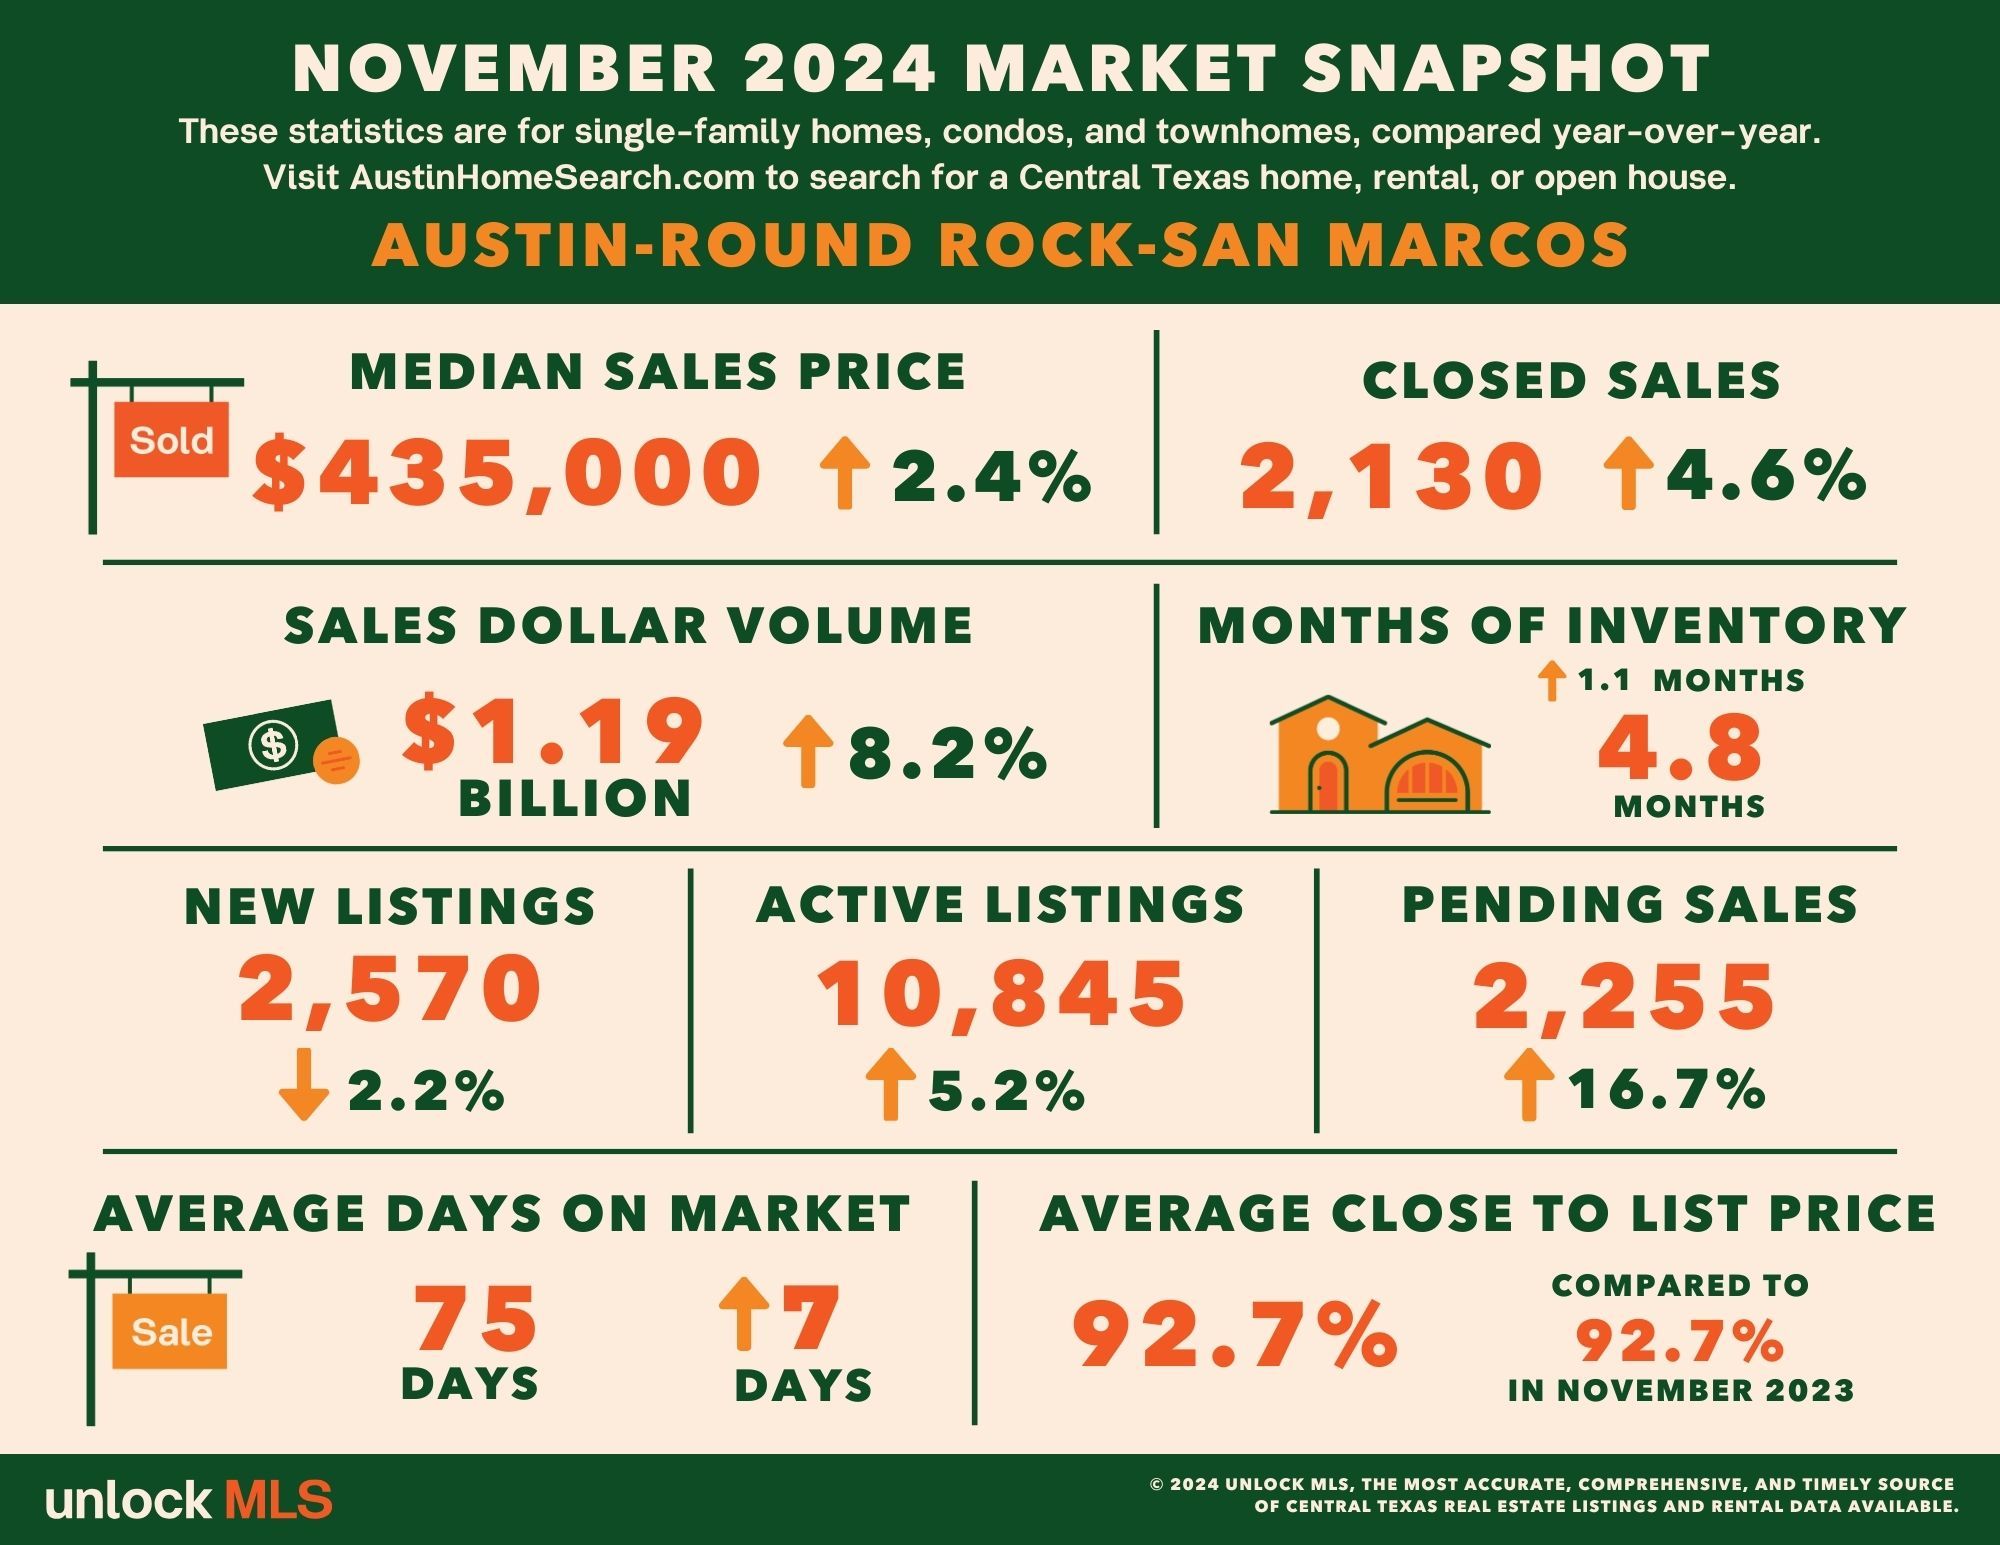
Austin-Round
Rock-San Marcos MSA
- 2,130 – Residential homes sold, 4.6% more
than November 2023.
- $435,000 – Median price for residential
homes, 2.4% more than November 2023.
- 2,570 – New home listings on the market,
2.2% less than November 2023.
- 10,845 – Active home listings on the
market, 5.2% more than November 2023.
- 2,255 – Pending sales, 16.7% more than
November 2023.
- 4.8 – Months of inventory, 1.1 months
more than November 2023.
- $1,193,804,656 – Total dollar volume of homes
sold, 8.2% more than November 2023.
- 92.7% – Average close to list price, flat
compared to November 2023.
City
of Austin
- 674 – Residential homes sold, 9.2% more
than November 2023.
- $573,400 – Median price for residential
homes, 2.0% more than November 2023.
- 835 – New home listings on the market,
7.9% less than November 2023.
- 3,778 – Active home listings on the
market, 3.8% more than November 2023.
- 738 – Pending sales, 29.7% more
than November 2023.
- 5.3 – Months of inventory, 1.5 months
more than November 2023.
- $512,095,983 – Total dollar volume of homes
sold, 13.9% more than November 2023.
- 91.8% – Average close to list price,
compared to 92.0% in November 2023.
Travis
County
- 899 – Residential homes sold, 6.0% more
than November 2023.
- $515,000 – Median price for residential
homes, 4.1% more than November 2023.
- 1,153 – New home listings on the
market, 5.3% less than November 2023.
- 5,115 – Active home listings on the
market, 2.9% more than November 2023.
- 1,009 – Pending sales, 30.2% more than
November 2023.
- 5.4 – Months of inventory, 1.5 months
more than November 2023.
- $621,458,660 – Total dollar volume of homes
sold, 8.9% more than November 2023.
- 92.4% – Average close to list price,
compared to 91.9% in November 2023.
Williamson
County
- 752 – Residential homes sold, 5.2% more
than November 2023.
- $423,120 – Median price for residential
homes, 1.0% more than November 2023.
- 744 – New home listings on the market,
9.4% less than November 2023.
- 3,047 – Active home listings on the
market, 5.2% more than November 2023.
- 770 – Pending sales, 2.7% more than
November 2023.
- 3.9 – Months of inventory, 0.9 months
more than November 2023.
- $359,872,646 – Total dollar volume of homes
sold, 8.2% more than November 2023.
- 93.3% – Average close to list price, flat
to November 2023.
Hays
County
- 363 – Residential homes sold,
3.4% more than November 2023.
- $368,015 – Median price for residential
homes, flat compared to November 2023.
- 474 – New home listings on the
market, 12.6%more than November 2023.
- 1,830 – Active home listings on the
market, 7.0% more than November 2023.
- 353– Pending sales, 13.5% more than
November 2023.
- 4.5 – Months of inventory, 0.5 months
more than November 2023.
- $166,391,051 – Total dollar volume of homes
sold, 6.8% more than November 2023.
- 92.0% – Average close to list price,
compared to 92.9% in November 2023.
Bastrop
County
- 87 – Residential homes sold, 9.8% more
than November 2023.
- $372,500 – Median price for residential
homes, 6.4% more than November 2023.
- 161 – New home listings on the market,
15.8% more than November 2023.
- 664 – Active home listings on the
market, 20.9% more than November 2023.
- 101 – Pending sales, 34.7% more than
November 2023.
- 7.0 – Months of inventory, 2.3 months
more than November 2023.
- $37,020,581– Total dollar volume of homes
sold, 19.5% more than November 2023.
- 92.1% – Average close to list price,
compared to 91.3% in November 2023.
Caldwell
County
- 30 – Residential homes sold, 31.3%
less than November 2023.
- $286,000 – Median price for residential
homes, 4.7% less than November 2023.
- 38 – New home listings on the
market, 26.7% more than in November 2023.
- 189 – Active home listings on the
market, 4.4% more than November 2023.
- 22 – Pending sales, 4.8% more than
November 2023.
- 4.0 – Months of inventory, 0.3 months
less than November 2023.
- $9,061,719 – Total dollar volume of homes
sold, 32.7% less than November 2023.
- 94.4% – Average close to list price,
compared to 95.9% in November 2023.
For
more information or to download the November 2024 Central Texas Housing Report,
visit UnlockMLS.com/Stats.


