Published July 1, 2026
May 2026 Central Texas Housing Report

AUSTIN, Texas — According to the May 2026 Central Texas Housing Report released by Unlock MLS, the Austin-Round Rock-San Marcos MSA carried strong spring momentum into the start of summer as homebuyers remained active throughout the peak selling season, signaling that the market’s early-year momentum has continued beyond the temporary mortgage rate relief that encouraged many buyers to re-enter the market earlier this year. Pending sales increased 14.3% year over year to 3,310 transactions in May, remaining near April’s elevated level of 3,411 pending sales, while closed sales rose 3.4% year over year to 2,953 sales, reinforcing the durability of buyer demand across the region. As the market heads into the summer season, continued buyer activity reflects growing confidence despite ongoing affordability challenges and economic uncertainty.
Vaike O’Grady, market research advisor at Unlock MLS, said May’s data suggests buyers are increasingly adapting to current market conditions rather than waiting for perfect circumstances to make a move.
“What’s particularly notable about May’s housing activity is that buyers continued to engage with the market even as many of the factors that typically create hesitation, such as affordability challenges and economic uncertainty, remained in place. That tells us consumers are making decisions based on long-term life goals and housing needs rather than trying to perfectly time the market. We’re also seeing encouraging signs of stability across key indicators, including home prices, days on market and close-to-list price ratios. Together, those trends point to a market that is functioning in a healthy and predictable way, giving both buyers and sellers greater confidence as they navigate their next move.”
John Crowe, 2026 Unlock MLS and ABoR president, said the region’s continued housing activity reflects the strength of the Central Texas housing market.
“Central Texas remains one of the most dynamic regions in the country, and the sustained buyer activity we’re seeing this spring reflects the quality of life and strong communities that make this area so attractive. For consumers, one of the biggest benefits of today's market is having the ability to be more intentional about their next move. Rather than racing against rapidly changing conditions, buyers and sellers have an opportunity to evaluate their options, ask questions and make informed decisions. A professional agent can help guide that process and provide the local perspective needed to navigate it successfully.”
Austin-Round Rock-San Marcos MSA
May 2026 – For Sale
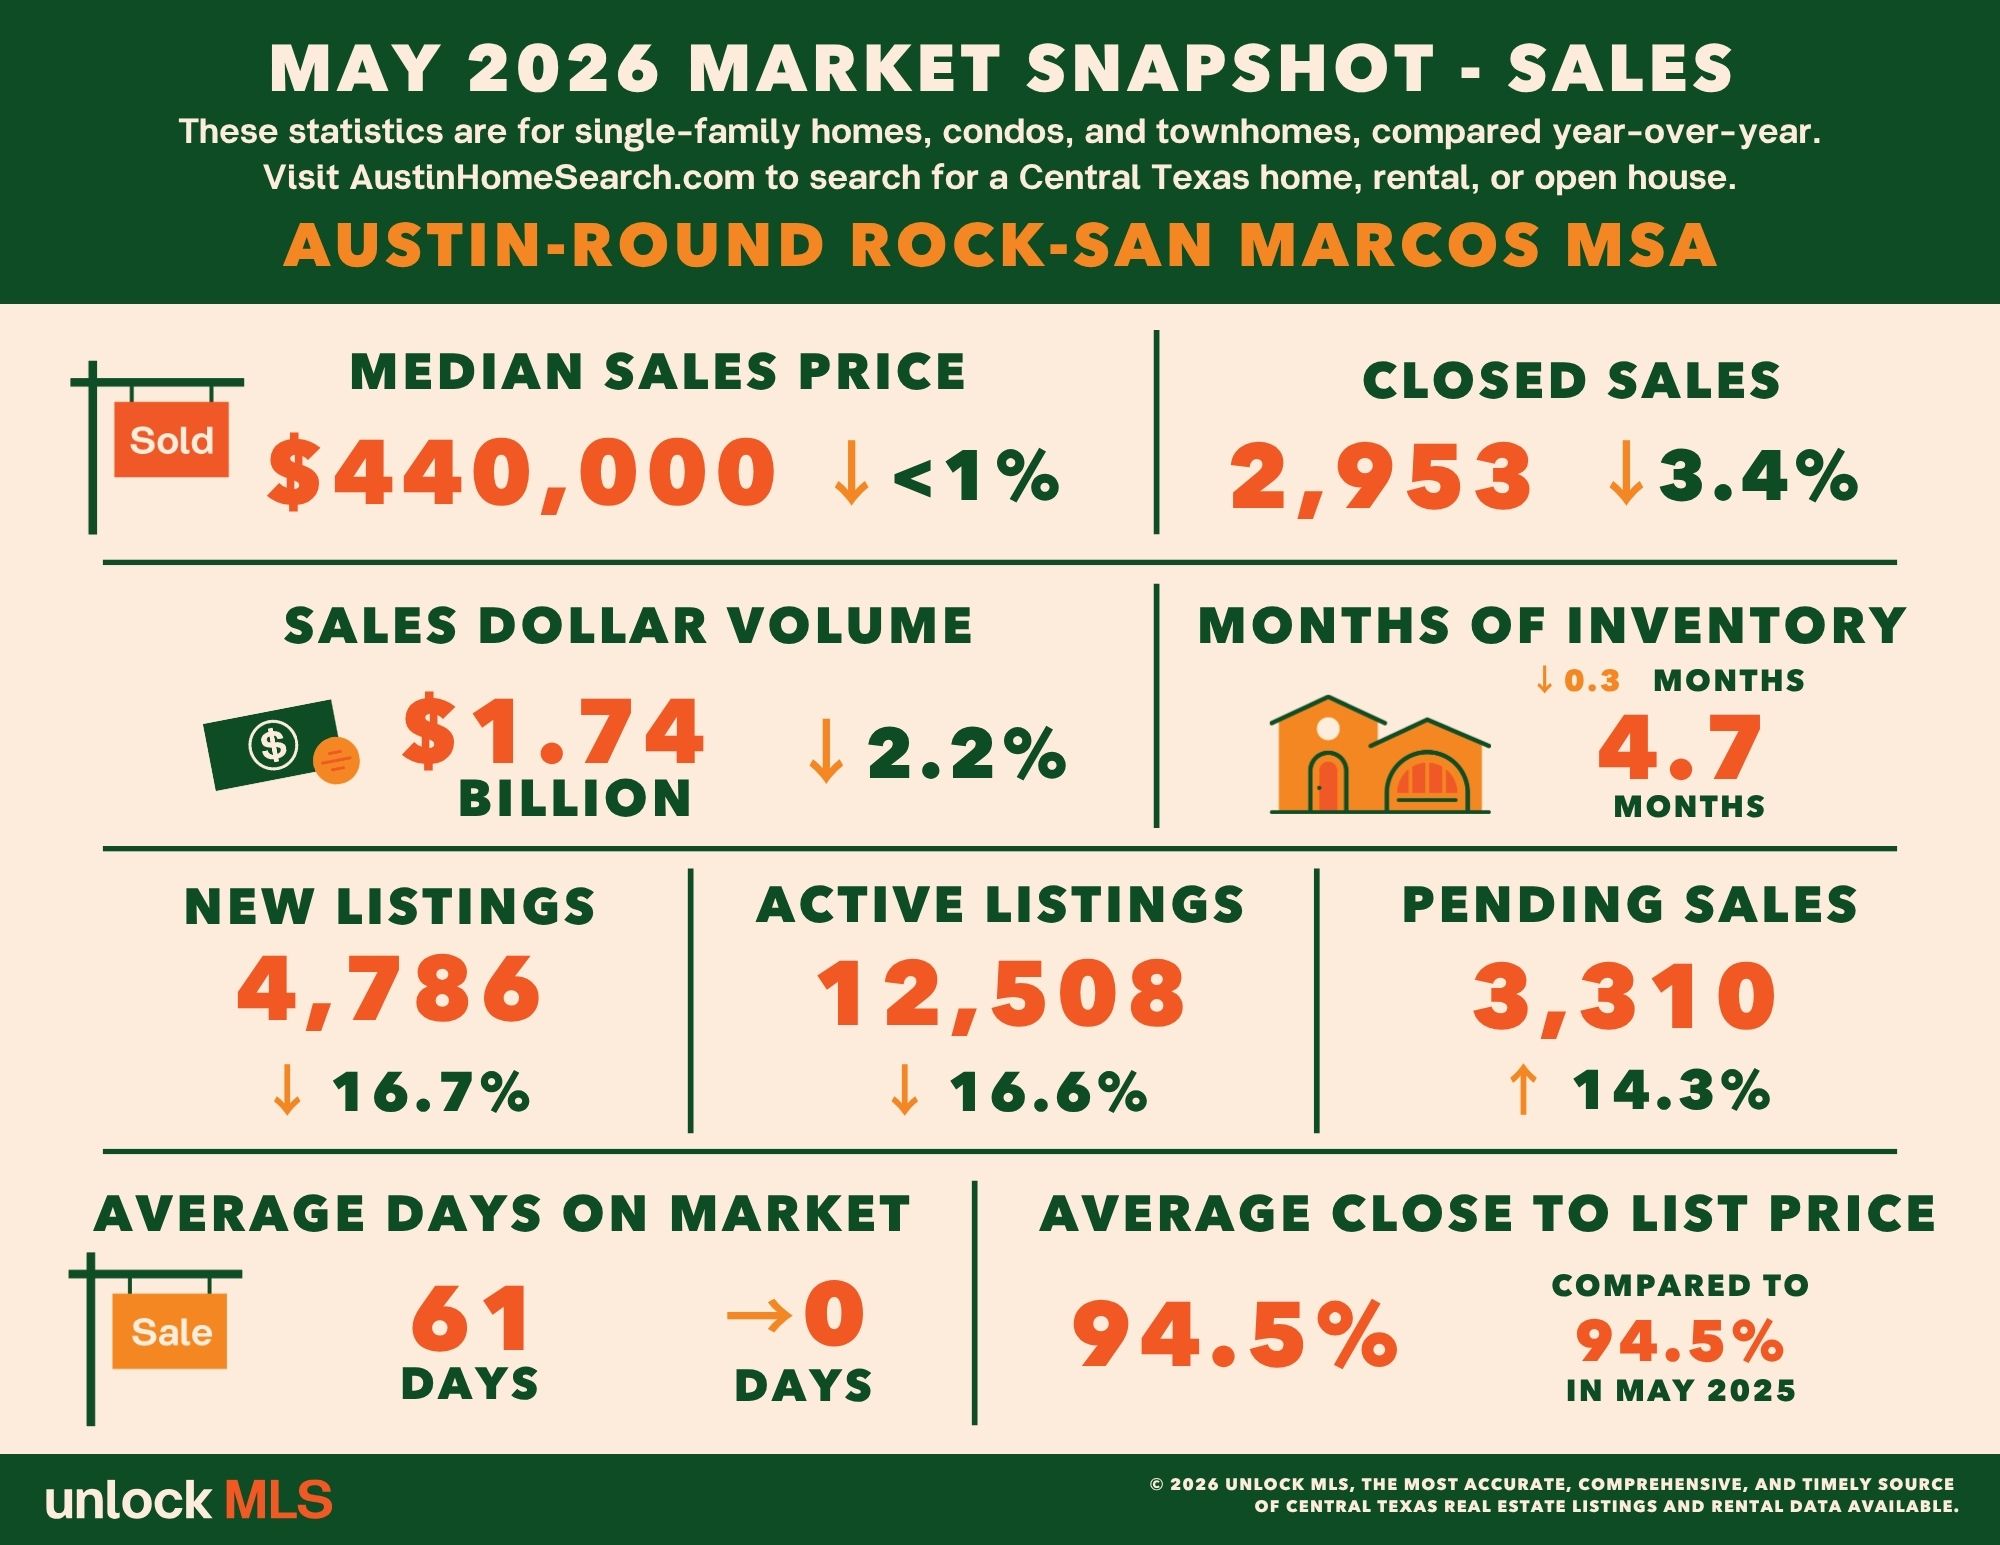
2,953 – Residential homes sold, 3.4% more than May 2025.
$440,000 – Median price for residential homes, less than 1% more than May 2025.
4,786 – New home listings on the market, 7.7% less than May 2025.
12,508 – Active home listings on the market, 16.6% less than May 2025.
3,310 – Pending sales, 14.3% more than May 2025.
4.7 – Months of inventory, 0.3 months less than May 2025.
$1,742,934,313 – Total dollar volume of homes sold, 2.2% less than May 2025.
94.5% – Average close to list price, compared to 94.5% in May 2025.
May 2026 – For Lease
2,597 – Closed leases, 2.3% less than May 2025.
$2,100 – Median price for rent, 4.5% less than May 2025.
3,345 – New lease listings on the market, 6.0% less than May 2025.
3,697 – Active lease listings on the market, 8.6% less than May 2025.
3,040 – Pending leases, 7.8% more than May 2025.
1.7 – Months of inventory, 0.1 months less than May 2025.
$6,186,498 – Total dollar volume of leases, 4.6% less than May 2025.
97.8% – Average close to list price, compared to 97.6% in May 2025.
City of Austin
May 2026 – For Sale
1,112 – Residential homes sold, 8.8% more than May 2025.
$575,000 – Median price for residential homes, 2.5% less than May 2025.
1,840 – New home listings on the market, 13.8% less than May 2025.
4,116 – Active home listings on the market, 20.9% less than May 2025.
1,184 – Pending sales, 14.2% more than May 2025.
4.4 – Months of inventory, 1.1 months less than May 2025.
$827,532,531 – Total dollar volume of homes sold, 6.3% more than May 2025.
95.1% – Average close to list price, compared to 95.0% in May 2025.
May 2026 – For Lease
1,316 – Closed leases, 1.0% less than May 2025.
$2,150 – Median price for rent, 4.4% less than May 2025.
1,708 – New lease listings on the market, 5.5% less than May 2025.
1,945 – Active lease listings on the market, 8.2% less than May 2025.
1,538 – Pending leases, 8.2% more than May 2025.
2.0 – Months of inventory, unchanged from May 2025.
97.7% – Average close to list price, compared to 97.5% in May 2025.