Published December 1, 2023
October 2023 Central Texas Housing Market Report

ABoR: Buyers willing to enter market despite higher interest rates
Closed sales increase, median price declines across MSA
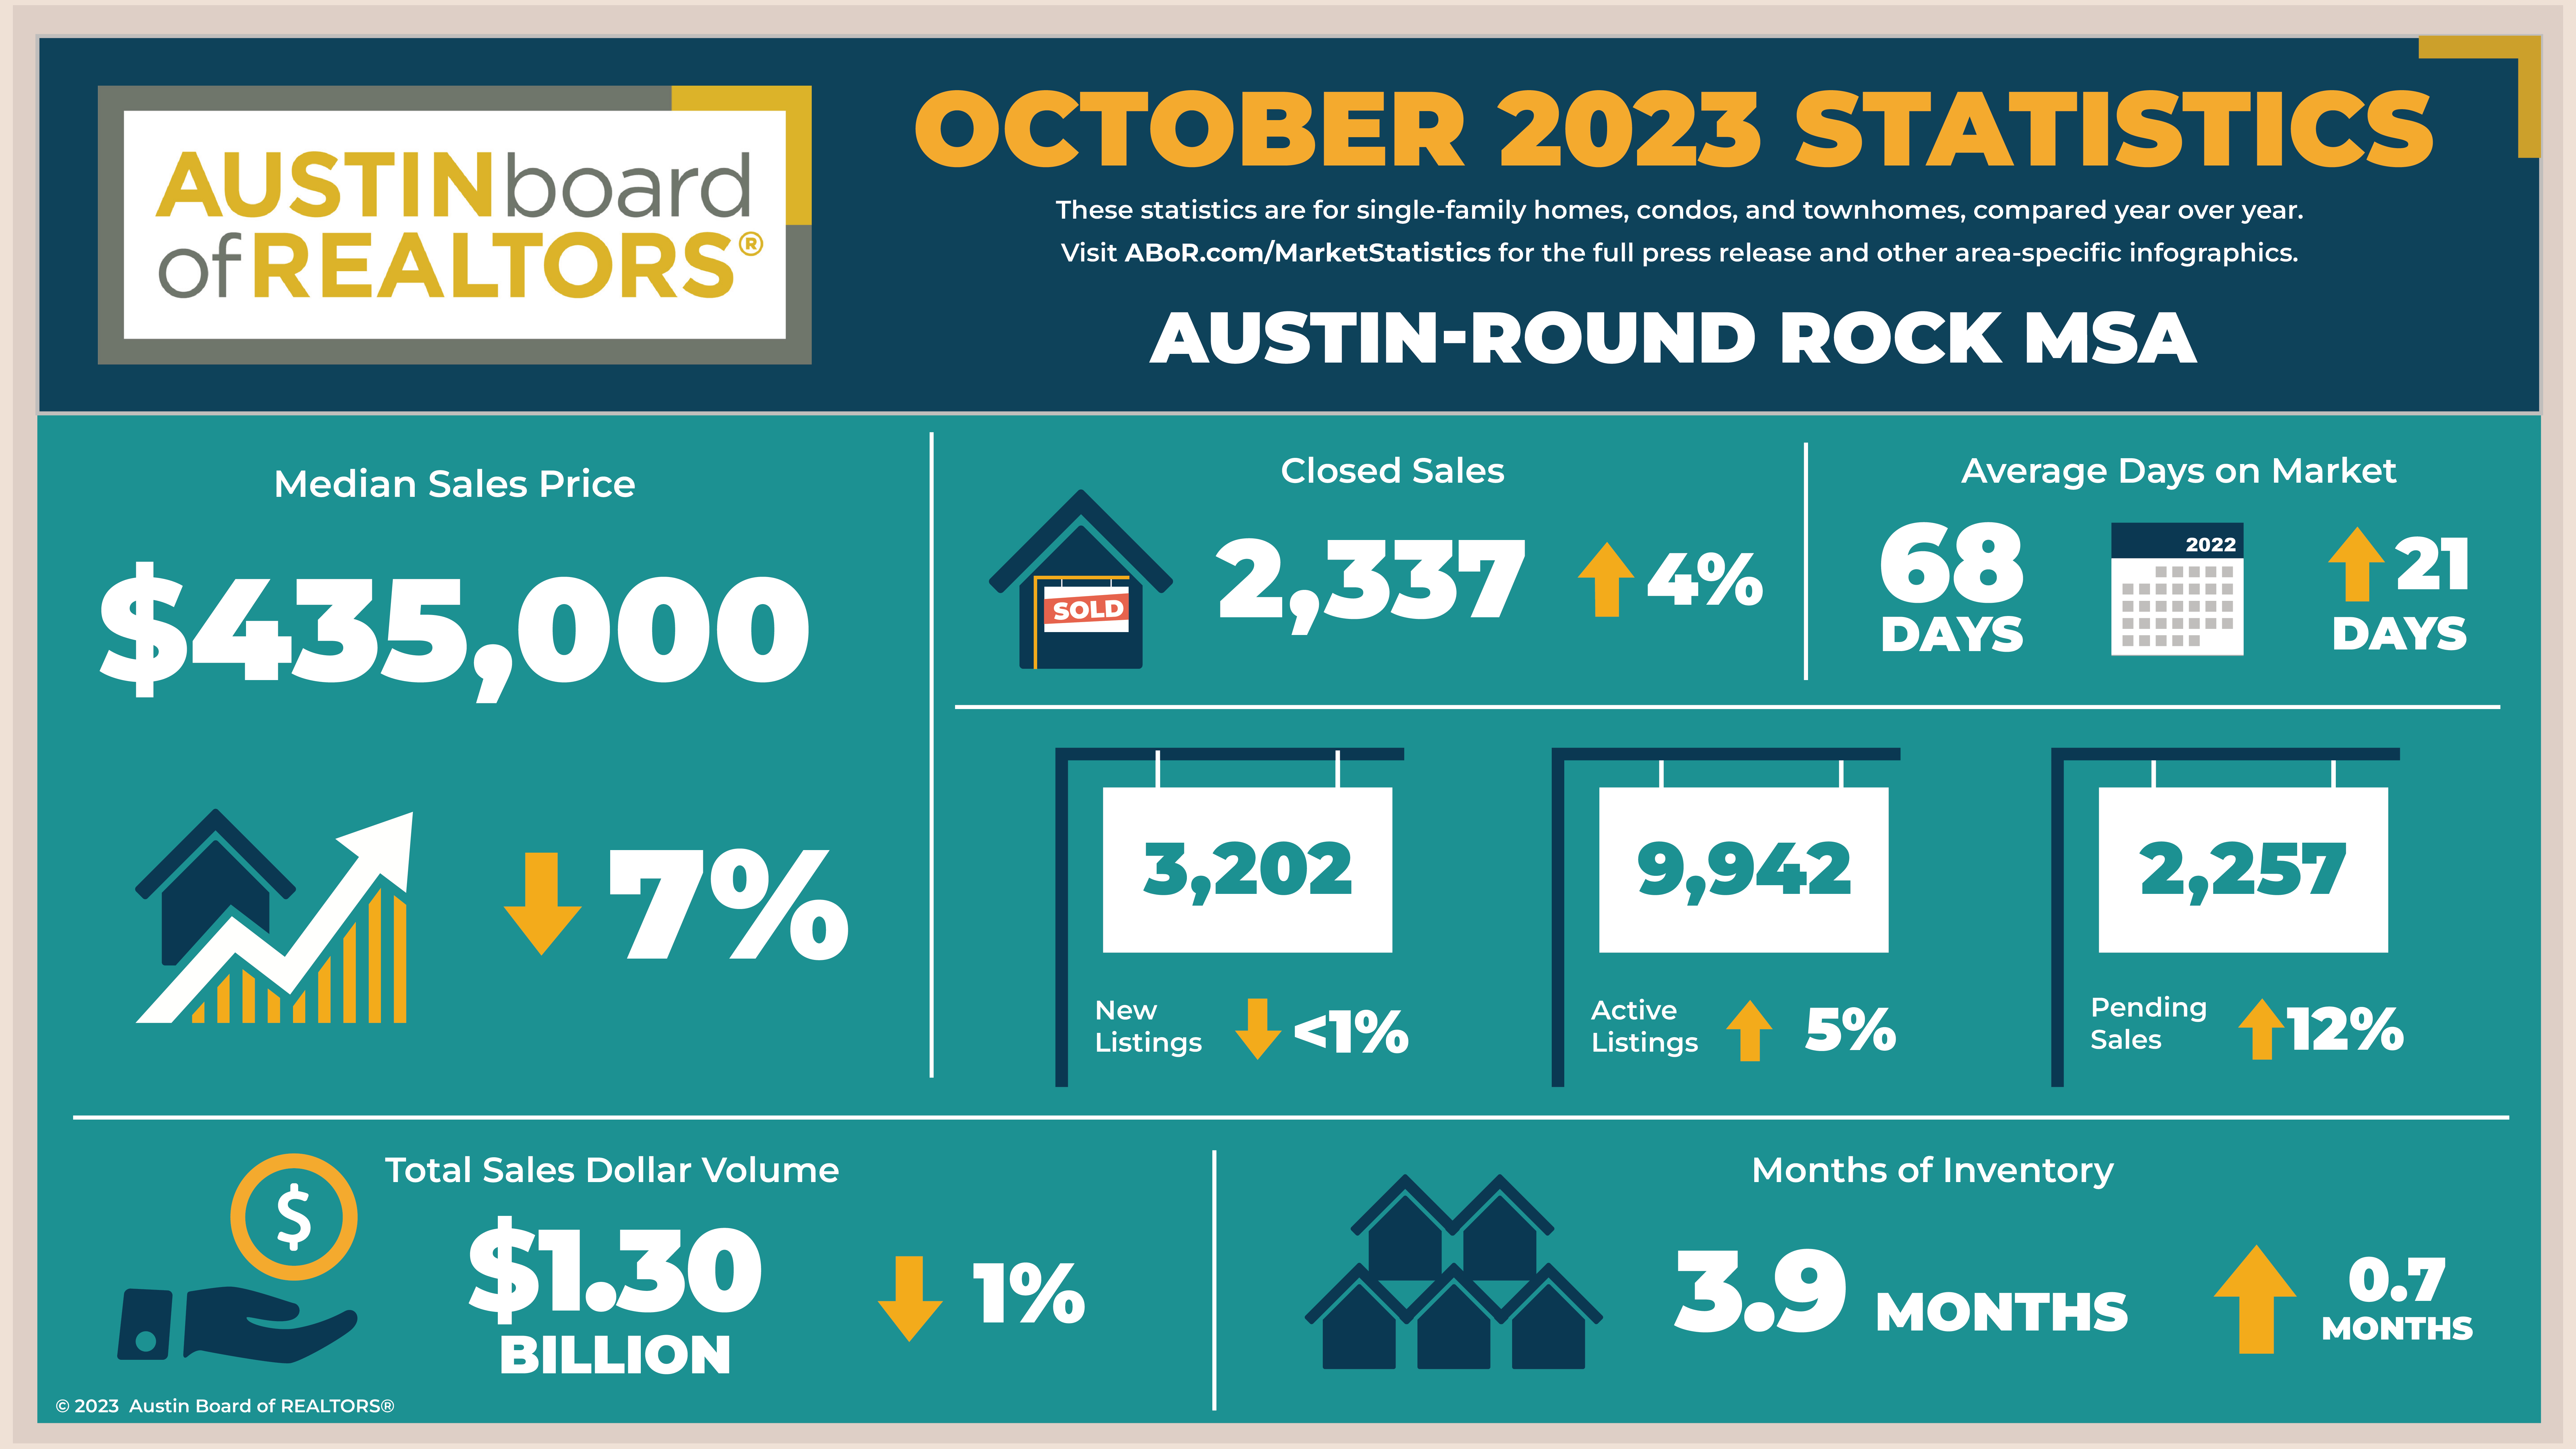
AUSTIN, Texas — The median home price across the Austin-Round Rock MSA dropped 7.5% to $435,000 in October, according to the Austin Board of REALTORS® October 2023 Central Texas Housing Market Report. The market experienced an increase in residential homes sold across the MSA, which rose 4.1% to 2,337 total sales demonstrating that buyers are finding value in the market despite higher interest rates.
“An increase in sales and a jump in pending sales indicates buyers continue to enter the market and are finding more bargaining power throughout the transaction,” Ashley Jackson, 2023 ABoR president, said. “The market is still normalizing, and as we look to the end of the year, it’s important to remember that working with a REALTOR? who can share their expertise and help buyers and sellers alike, is the surest path to success in this market.”
In October, sales dollar volume ticked down 1.5% year over year to $1,307,192,441 across the MSA. Homes spent an average of 68 days on the market, up 21 days from October 2022 and housing inventory increased 0.7 months to 3.2 months of inventory. New listings dipped 0.8% to 3,202 listings, active listings increased 5.2% year over year to 9,942 listings and pending listings rose 12.0% year over year to 2,257 listings.
Clare Losey, Ph.D., housing economist for ABoR, noted that interest rates from late summer did not prevent buyers from showing a willingness to enter the market in October.
“Despite higher mortgage rates this summer and fall, closed sales across the MSA rose 4.1% year over year in October to 2,337 sales. With the close to original list price ratio hitting 93.1% in October, it is also a reminder that buyers have more negotiating power than at virtually any point since March 2020.”
Losey noted that the decrease in median sales price year over year pales in comparison to the equity gained over a longer period of time.
“The median price is still 44% higher than it was in September 2018. Homeownership is still the best way to create generational wealth, and the region would benefit from reforms and policies that make homes more attainable and buying more accessible for people across different income levels.”
Jackson also added that ABoR’s newest research report, “The Truth About Austin’s Missing Housing -District Level Analysis,” sheds light on the severe undersupply of housing by City Council District and among five racial/ethnic groups, and what elected officials and policy makers can do to address the challenge.
“While we have seen noteworthy progress from local leaders, there is still so much to be done. Any new housing policies that don’t take this data in mind will not be a true housing solution. We must continue to work to increase the abundance and variety of housing to ensure that anyone who wants to buy a home in Austin can do so, and at a price point they can afford.”
City of Austin
602 – Residential homes sold, 3.5% less than October
$540,000 – Median price for residential homes, 1.8% less than October
977 – New home listings on the market, 2.6% less than October
2,917 – Active home listings on the market, 12.7% more than October
564 – Pending sales, 3.3% more than October
4.1 – Months of inventory, 1.3 months more than October 2022.
$413,742,262 – Total dollar volume of homes sold, 4.4% less than October
Travis County
957 – Residential homes sold, 7.7% less than October
$524,500 – Median price for residential homes, 1.2% less than October
1,519 – New home listings on the market, 1.8% less than October
4,798 – Active home listings on the market, 9.6% more than October
909 – Pending sales, 0.3% less than October
4.2 – Months of inventory, 1.2 months more than October 2022.
$668,881,399 – Total dollar volume of homes sold, 7.2% less than October
Williamson County
844 – Residential homes sold, 11.2% more than October
$424,990 – Median price for residential homes, 7.1% less than October
985 – New home listings on the market, 8.5% less than October
2,786 – Active home listings on the market, 12.6% less than October
794 – Pending sales, 14.1% more than October
3.2 – Months of inventory, the same amount as October 2022.
$403,613,886 – Total dollar volume of homes sold, 4.1% more than October
Hays County
360– Residential homes sold, 21.6% more than October
$373,294 – Median price for residential homes, 8.7% less than October
463 – New home listings on the market, 21.5% more than October
1,594 – Active home listings on the market, 24.7% more than October
370 – Pending sales, 44.5% more than October
4.4 – Months of inventory, 1.0 month more than October 2022.
$167,405,638 – Total dollar volume of homes sold, 6.3% more than October
Bastrop County
125 – Residential homes sold, 6.8% more than October
$349,850 – Median price for residential homes, 3.9% less than October
168 – New home listings on the market, 2.9% less than October
570 – Active home listings on the market, 16.1% more than October
125 – Pending sales, 5.9% more than October
4.7 – Months of inventory, 0.9 months more than October 2022 and the highest inventory in the MSA.
$49,146,166 – Total dollar volume of homes sold, 1.8% less than October
Caldwell County
51 – Residential homes sold, 45.7% more than October
$318,480 – Median price for residential homes, 0.2% more than October
67 – New home listings on the market, 31.4% more than October
194 – Active home listings on the market, 71.7% more than October 2022.
59 – Pending sales, 73.5% more than October
4.6 – Months of inventory, 1.9 months more than October 2022.
$16,851,436 – Total dollar volume of homes sold, 50.8% more than October
|


or another way