Published July 26, 2022
Austin-Round Rock MSA begins return to pre-pandemic housing market activity

Long-awaited gains in
housing inventory contribute to slower price growth, market stabilization in
first half of 2022
AUSTIN, TX —
According to the Austin Board of REALTORS® June and Mid-Year 2022 Central Texas Housing
Market Report, a triple-digit gain in active listings
year over year pushed housing inventory levels over two months in the
Austin-Round Rock MSA for the first time since November 2019. Combined with a
dip in residential home sales activity and a slowing pace of home price growth in
June, the data indicates a decelerating Austin housing market that is beginning
to return to pre-COVID normalcy.
“These numbers are a
breath of fresh air for a housing market that has been holding its breath,” Cord Shiflet,
2022 ABoR president, said. “The trajectory of our market over the last two
years was unsustainable and it was in no way going to last. The resurgence of
activity after the COVID-19 pandemic, historically low-interest rates, and
massive job growth created record-high housing demand in our market. We are now
seeing a move more towards pre-pandemic sales activity and inventory.
“The Austin market
is by no means balanced and it still favors sellers, but buyers have more
bargaining power now than at any point since before the pandemic. Homes still
closed at over 100% of the list price on average last month, but REALTORS® have started seeing lower list prices and
therefore sale prices, over the last few weeks.”
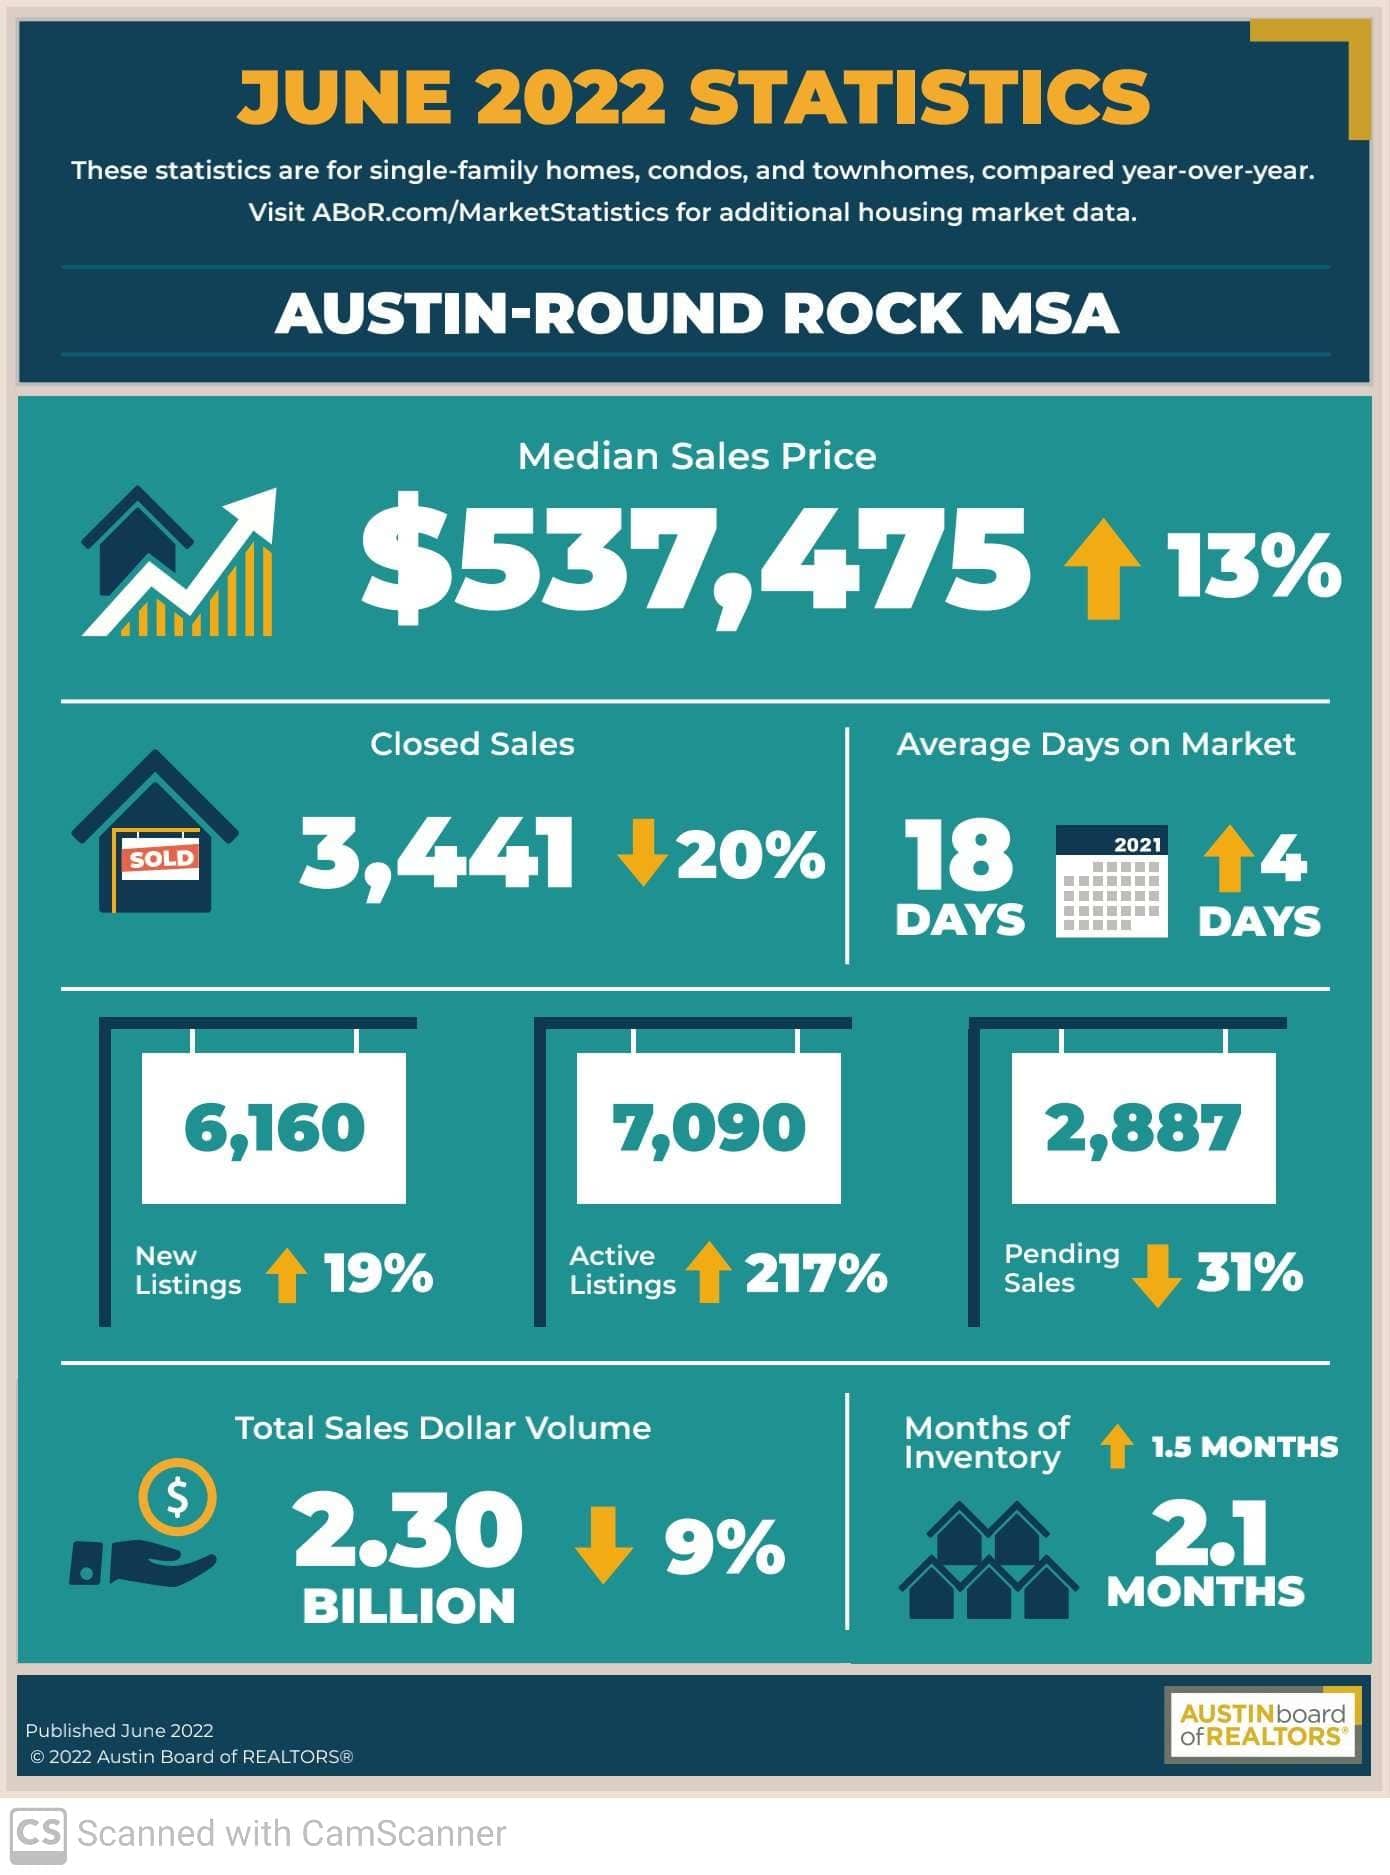
Last month across
the MSA, residential home sales declined 20.3% year over year to 3,441 closed
sales as the median price rose 13%, setting a record of $537,475 for the month
of June. Sales dollar volume dropped 9.9% to $2,301,865,479 while new listings
jumped 19.6% to 6,160 listing.
The number of homes
on the market skyrocketed 217.8% to 7,090 active listings, causing housing
inventory to jump to 2.1 months of inventory, up 1.5 months from last June.
While pending sales dropped 31.6% to 2,887 transactions, homes still went under
contract quickly, spending an average of 18 days on the market or four more
days than June 2021.
George Ratiu, senior economist
and manager of economic research at Realtor.com, weighed in on the
recent increase in inventory.
“When we look at the
data across the Austin housing market, it reinforces what we see on a national
scale—a combination of cooling demand from the tremendous surge in mortgage
rates and rising prices with a noticeable increase in supply. The shift signals
welcome news for more buyers who may be ready to embrace a post-pandemic
reality and take advantage of more inventory. This increase in supply combined
with cooling demand indicates the beginning of a more sustainable housing
market.”
Ratiu noted that
other metropolitan markets in the U.S., particularly throughout the south and
southeast regions, saw a similar trend with economic growth attracting buyers,
not only from the local markets, but importantly, buyers and new residents from
outside their regions, much like Austin.
“People have
internalized the narrative that the 2021 market was a normal market and many
buyers may have lost hope. Frankly, the 2021 market was anything but normal and
this transition signals that more hope for buyers is on the horizon.”
Ratiu and other
industry leaders will discuss the current and future state of the Austin-area
housing market at ABoR and the Austin Chamber’s 2022 Central Texas Housing
Summit on July 19, touching on issues affecting sellers, buyers, renters, and
homebuilders.
“Home prices are
still increasing at a faster pace than the 5-6% that’s historically considered
normal. However, that’s still much better than this time last year, when the
median price increased 43% year over year compared to June 2020. If you’ve been
on the fence about buying a home, you can take advantage of this increased
bargaining power and influx of homes on the market. As the fundamentals of our
market normalize, buyers and renters need to get their foot in the door, quite
literally, and work with their REALTOR® to
help them find their next home.” Shiflet said.
Austin-Round Rock MSA
In the first half of
2022, home sales in the Austin-Round Rock MSA decreased 7.7% year over year to
18,430 home sales. Sales dollar volume rose 7.7% to $11,904,623,551, while the
median price increased 19.7% to $525,000. So far this year, new listings are up
7.3% to 25,622 new listings; active listings skyrocketed 90.6% to 3,044 active
listings, and pending sales decreased 12.1% to 19,305 pending sales. Homes
spent an average of 21 days on the market from January through June 2022, one
fewer day than the same period in 2021.
City of Austin
In the City of
Austin, home sales in the first half of the year decreased 10.7% year over year
to 5,789 sales, while the median price increased 15.1% to $610,000. At the same
time, sales dollar volume rose 2.4% to $4,372,274,870. New listings decreased
0.8% to 7,788 listings; active listings increased 39.4% to 832 listings, and pending sales dropped 17.8% to 5,903 pending sales.
This June, home
sales dropped 22.9% year over year to 1,048 sales. At the same time, sales
dollar volume decreased 16.1% to $800,231,967, while the median price rose 7.9%
to $615,000–setting a record for the month of June. During the same period, new
listings increased 15% to 1,922 listings; active listings skyrocketed 144.9% to
1,935 active listings, and pending sales tumbled 35.5% to 872 sales. Housing
inventory increased from 1.1 months of inventory to 1.8 months of inventory.
Travis County
From January through
June in Travis County, home sales decreased 11.4% year over year to 8,920
sales. During the same period, sales dollar volume rose 0.9% to $6,716,534,179,
as the median price increased 17.2% to $597,500. New listings saw an uptick of
2.9% to 12,266 listings, while active listings rose 58% to 1,420 listings.
Pending sales fell 15.5% to 9,110 pending sales.
In June 2022, home
sales decreased 24.7% year over year to 1,576 sales, while sales dollar volume
dropped 16.1% to $1,240,583,715. During the same period, the median price
increased 10.2% to $611,500. New listings increased 15.6% to 2,995 listings;
active listings jumped 159.2% to 3,292 listings; while pending sales dropped
32.9% to 1,363 sales. Housing inventory rose from 1.3 months to 2 months of
inventory.
Williamson County
In Williamson
County, home sales in the first half of 2022 decreased 6.4% year over year to
6,116 home sales. During the same period, sales dollar volume increased by
14.1% to $3,360,779,966, and the median price rose 20.9% to $495,783. New
listings ticked up 5.3% to 8,414 listings; active listings soared 131% to 910
listings, while pending sales fell 13.9% to 6,345 pending sales.
This June, home
sales decreased 21.8% year over year to 1,179 sales. During the same period,
sales dollar volume dropped 8.6% to $677,528,395, and the median price climbed
14.6% to $510,000. New listings increased 17.8% to 2,070 listings, while active
listings also skyrocketed 279.8% to 2,294 listings. Pending sales fell 37% to
959 pending sales. Housing inventory more than doubled to 2 months of inventory.
Hays County
In the first half of
2022, Hays County home sales ticked down 1.4% year over year to 2,369 sales,
and sales dollar volume rose 22.6% to $1,377,122,510. During the same period,
the median price increased 27.1% to $445,000. New listings increased 14.4% to
3,370 listings; active listings jumped 151% to 482 listings, and pending sales
fell 4.3% to 2,664 pending sales.
In June 2022, home
sales decreased 4.1% year over year to 490 home sales, as sales dollar volume
rose 12.2% to $285,813,956. During the same period, the median price climbed
18.1% to $452,727. New listings increased 20.8% to 731 listings; active
listings soared 338.6% to 1,035 listings, and pending sales dropped 24% to 386
pending sales. Inventory increased from 1.9 months to 2.5 months of inventory.
Bastrop County
In the first half of
2022, Bastrop County home sales slightly fell 1.1% year over year to 779 home
sales, and sales dollar volume increased 33.1% to $356,826,561. The median
sales price increased 39.8% to $405,500. During the same period, new listings
rose 38.5% to 1,177 listings, while active listings jumped 128.4% to 185 listings.
At the same time, pending sales ticked up 0.9% to 857 pending sales.
In June 2022, home sales increased 1.2% year over year to 163 home sales, and sales dollar volume rose 30.2% to $82,127,408. At the same time, the median price increased 29.7% to $420,250. New listings jumped 84.2% to 280 listings; active listings skyrocketed 325.3% to 387 active listings while pending sales fell flat at 124 pending sales. Inventory jumped from 2.3 months to 3 months of inventory.
Caldwell County
To date in 2022, Caldwell County home sales increased 32.3% year over year to 246 sales, and sales dollar volume increased 59.2% to $90,032,286. The median price climbed 33.6% to $335,000. During the same period, new listings jumped 114.7% to 395 listings; active listings rose 46.7% to 44 listings while pending sales also increased 85.9% to 329 pending sales.
In June 2022, home sales dropped 23.3% year over year to
33 home sales, and sales dollar volume fell 14.6% to $13,022,017. During the same
period, the median price rose 7.1% to $331,950. New listings increased 90.9% to
84 listings; active listings soared 173.3% to 82 listings. Pending sales
increased 52.8% to 55 pending sales. Housing inventory jumped from 1.3 months to 2.2
months of inventory.

Chris Anderson
Realtor | Chris Anderson | 12 Rivers Realty
or another way