Published August 30, 2022
Austin-Round Rock MSA housing market continues to normalize as price growth slows, inventory rises

Home price growth in single digits for the first
time since June 2020
AUSTIN,
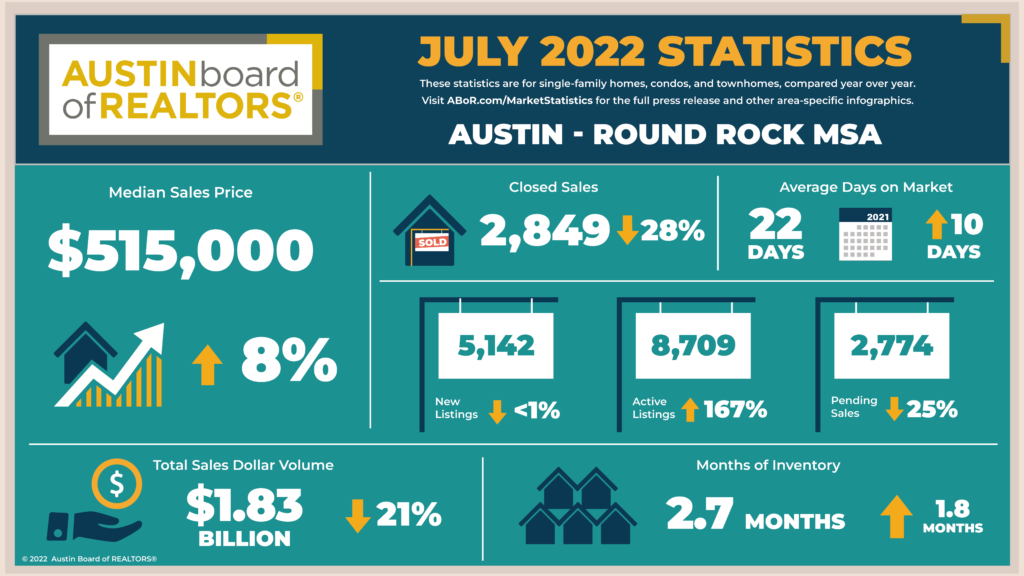
Texas — The Austin-Round Rock MSA housing market continued to trend towards
more normal and sustainable levels in July, according to the Austin
Board of REALTORS® July 2022 Central Texas Housing Market
Report. Median
price grew by only 8% year over year to $515,000, a record for the month of
July but the first-time home price growth has been in the single digits since
June 2020. The region’s housing inventory reached 2.7 months — the highest
level of inventory since November 2018.
“In every
aspect of our market REALTORS® are seeing positive signs that Austin’s housing
market continues to normalize,” Cord Shiflet, 2022 ABoR president,
said. “On top of rising housing inventory, home price growth is much closer to
the 4-5% annual growth that is typical for a healthy market. In addition, homes
sold slightly below list price for the first time since December 2020, proving
that buyers are gaining negotiating power in the market.”
In July,
residential home sales declined 28.3% year over year to 2,849 closed sales,
sales dollar volume declined 21.9.% to $1,837,933,383, and new listings
remained consistent with a 0.2% decline to 5,142 listings. The average close to
list price for residential homes was 98.8% in July 2022, a significant change
from the average 104.1% close to list price for the first half of the year.
Homes
spent an average of 22 days on the market, 10 days more than July 2021 and
active listings skyrocketed 167.9% to 8,709 listings. At the same time, pending
sales declined 25.9% to 2,774 pending sales.
Ryan
Leahy,
regional president for Austin mortgage lending company HomeTown Texas and
an ABoR Affiliate member, sees corresponding levels of activity occurring on
the lending side of real estate transactions.
“The
Austin real estate market’s inventory and mortgage interest rates have returned
to pre-pandemic levels in recent months. It’s not the intense sellers’ market
it was a few months ago and sellers should reset their expectations. For the
first time in a long time, buyers have more flexibility and leverage in the
transaction.”
Leahy
emphasized the importance of clients learning as much about the offer process
as possible.
“We
prioritize educating both our agents and borrowers on how to structure offers
so both buyers and sellers win. We’re able to explore creative financing
options with our clients that make homeownership accessible, such as all-cash
financing and seller buy-downs of interest rates, that can result in win-win
scenarios for both buyers and sellers. This strategy is timely, and REALTORS® tell us it is game
changing.”
Shiflet
added that while increased inventory and slower price growth are positive, this
does not mean policy makers and elected officials should back away from
prioritizing housing.
“Our
position at the Austin Board of REALTORS® hasn’t changed: there is a lot of work to be done
to address both the present and future of housing in our region. We need
elected officials who will prioritize housing, and our community needs to work
together to find solutions so that anyone that wants to buy a home in Austin
can do so within their budget.”
City of
Austin
In July,
home sales decreased 35.3% to 835 sales, while sales dollar volume decreased
28.7% to $637,525,270. At the same time, median price rose 11.1% setting a
record for the month of July of $633,000 for the City of Austin. Last month,
new listings slightly decreased 0.8% to 1,592 listings, active listings rose
127.8% to 2,410 listings as pending sales dropped by 32.4% to 799 pending
sales. Monthly housing inventory increased 1.5 months year over year to 2.4
months of inventory.
Travis
County
In Travis
County, home sales decreased 33.3% to 1,282 sales, while sales dollar volume
decreased 25.9% to $1,000,015,035. Last month, median price in Travis County
rose 10.9% year over year to $610,000 as new listings decreased 1.0% to 2,531
listings and active listings increased 137.1% to 4,095 listings year over year.
Pending sales declined 33.5% to 1,247 as monthly housing inventory increased
1.6 months year over year to 2.6 months of inventory.
Williamson
County
May home
sales decreased 32.4% to 961 sales in Williamson County. Sales dollar volume
declined 25.7% year over year to $520,878,028. The median price increased 10.2%
to $485,000 as new listings ticked up 0.2% to 1,743 listings. During the same
period, active listings soared 187.4% to 2,868 listings while pending sales
dropped 22.5% to 956 pending sales. Housing inventory rose 1.8 months to 2.6
months of inventory.
Hays
County
In Hays
County, May home sales decreased 6.6% to 427 sales, while sales dollar volume
slightly declined 0.2% to $237,147,876. The median price for homes increased
15.4% to $450,000. During the same period, new listings declined 3.9% to 599
listings, while active listings skyrocketed by 224.3% to 1,213 listings.
Pending sales decreased 9.1% to 412 pending sales as housing inventory jumped
by 2.1 months to 3.0 months of inventory.
Bastrop
County
Last
month, Bastrop County home sales decreased 15.1% year over year to 124 sales,
while sales dollar volume fell by 0.9% to $54,854,358. Median price increased
17.5% to $415,000 as new listings rose 21.9% to 217 listings. Active listings
soared 302.8% to 439 listings as pending sales decreased 17.6% to 117 pending
sales. Housing inventory increased 2.6 months to 3.4 months of inventory, the
highest level of inventory across the MSA in July.
Caldwell
County
In
Caldwell County in July, home sales increased 103.7% to 55 home sales, and
sales dollar volume rose 170.8% to $22,493,577. The median home price rose
45.1% year over year to $379,536. At the same time, new listings decreased by
3.7% to 52 listings as active listings increased 118.6% to 94 listings. Pending
sales rose 10.5% to 42 pending sales, and housing inventory increased 1.0
months to 2.4 months of inventory.
For more
information or to download the July 2022 Central Texas Housing Market
Report, visit ABoR.com/MarketStatistics.
|


or another way