Published January 20, 2025
December 2024 Central Texas Housing Market Report

AUSTIN, Texas — In 2024,
closed sales across the Austin-Round Rock-San Marcos MSA remained stable,
ticking down 0.5% to 29,872 sales, according to the December
2024 and Year-End Central Texas Housing Market Report released
by Unlock MLS today. During the same period, active listings increased 14.7% to
132,993 listings offering buyers more opportunities. Together, the data
reflects buyers’ ability to find homes that meet their needs within the current
market conditions and sellers viewing the market as favorable.
Clare Knapp, Ph.D., housing
economist for Unlock MLS and the Austin Board of REALTORS®, predicts that the
coming year will mirror 2024’s conditions offering consistency for homebuyers
and sellers.
“2025 market activity will
likely look similar to trends observed in 2024 with the median sales price and
closed sales hovering between 5% up or down year-over-year. This stability will
give homebuyers and sellers clear expectations to plan their next steps more
confidently. Additionally, mortgage rates will likely hover between 6 and 7%,
as the Federal Reserve adopts a cautious approach to potential rate cuts. This
consistency will allow both buyers and sellers to benefit from a predictable
lending environment. However, external factors, such as economic shifts or
policy changes, could influence these trends, underscoring the importance of
staying informed and adaptable to navigate the market successfully.”
Knapp added that while 2024
was a better year for first-time home buyers due to the increase in supply,
there is still much work to be done to tackle the region’s affordability
issues.
Brandy Wuensch, 2025 Unlock
MLS and ABoR president, emphasized the advantages buyers and sellers have in
the new year.
“There are unique
opportunities for both buyers and sellers this new year. For buyers, the MSA
has the highest inventory levels seen in over a decade, offering more choices
and greater leverage in negotiations. Sellers, meanwhile, can capitalize on
significant equity gains accrued over the past few years. We are finally seeing
predictability in our market, making this an ideal time to pursue homeownership
goals with the guidance of a licensed professional agent.”
Wuensch also said that the
Austin Board of REALTORS® looks forward to the continued collaboration
with the City of Austin to address the region’s affordability issues this year.
"While the increase of
supply across the MSA helped ease affordability constraints, it does not solve
long-term affordability challenges. In 2024, the Austin City Council took bold
steps to address Austin’s affordability crisis to make housing more attainable
to Austinites especially teachers, first responders, young professionals, and
retirees by revising outdated land development codes. We are proud to have
played a part in driving this progress forward. As we look to the future, we
are eager to continue collaborating with Council on additional reforms to
address the affordability challenges in our region to ensure we are building a
more affordable and attainable Austin for everyone.”
Austin-Round Rock-San Marcos
MSA
2024
- 29,872 –
Residential homes sold, 0.5% less than 2023.
- $445,000 – Median
price for residential homes, 1.7% less than 2023.
- 45,449 – New home
listings on the market, 8.7% more than 2023.
- 132,993 –
Active home listings on the market, 14.7% more than 2023.
- 30,369 –
Pending sales, 2.2% more than 2023.
- $17,094,934,330 –
Total dollar volume of homes sold, 1.5% less than 2023.
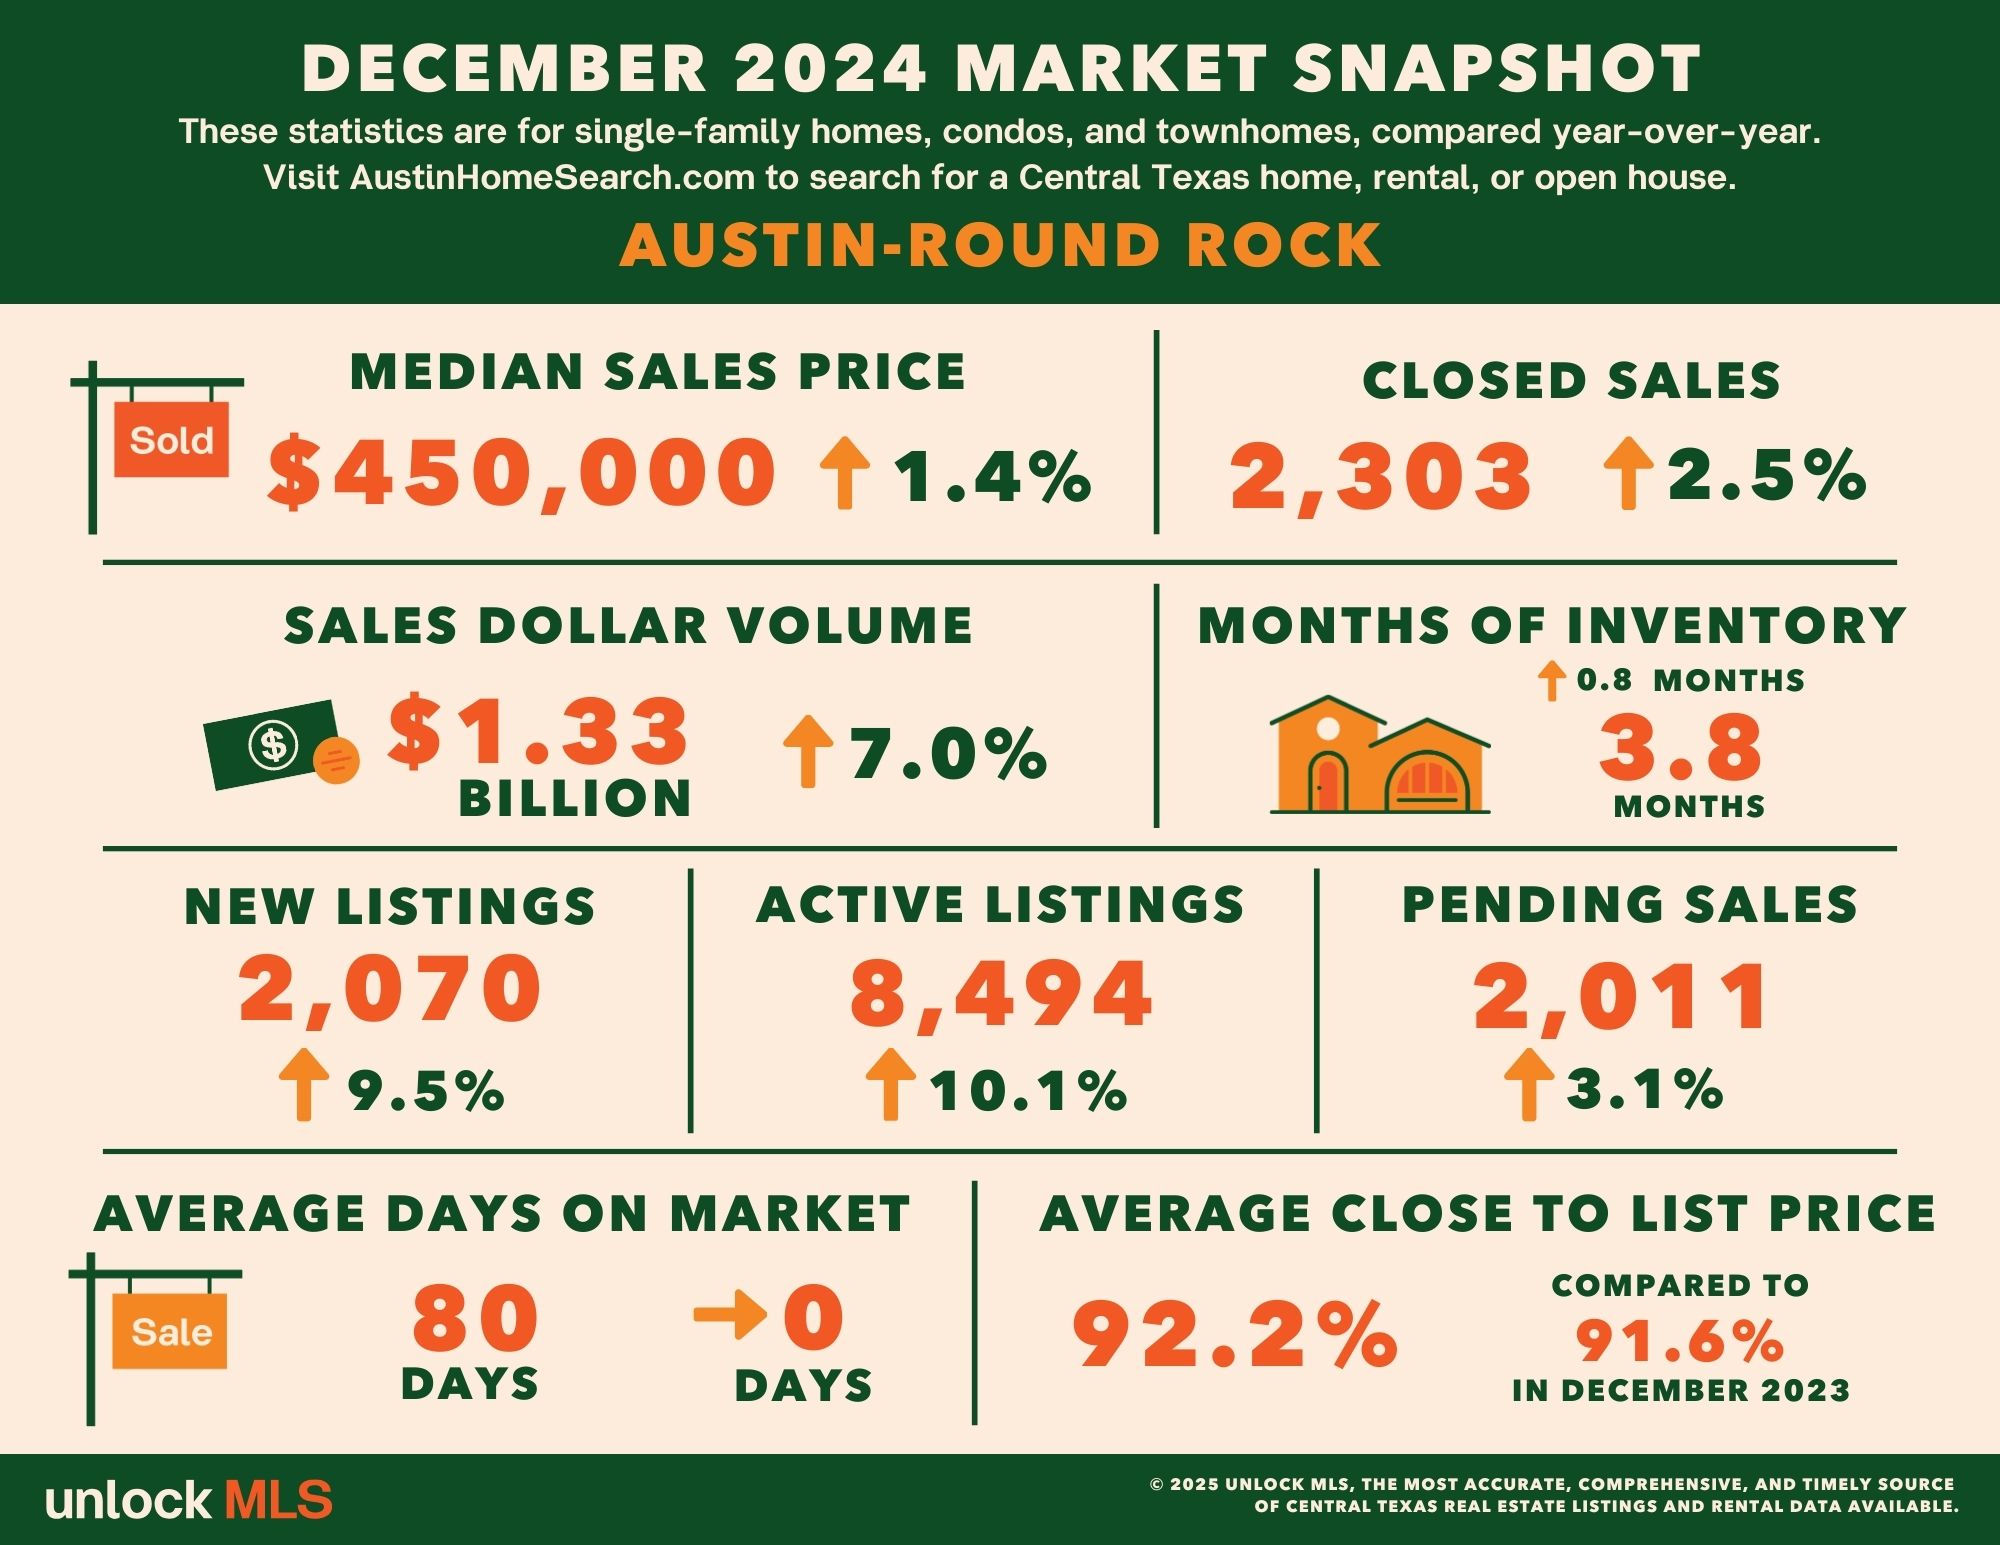
December 2024
- 2,303 –
Residential homes sold, 2.5% more than December 2023.
- $450,000 –
Median price for residential homes, 1.4% more than December 2023.
- 2,070 –
New home listings on the market, 9.5% more than December 2023.
- 8,494 –
Active home listings on the market, 10.1% more than December 2023.
- 2,011 –
Pending sales, 3.1% more than December 2023.
- 3.8 –
Months of inventory, 0.8 months more than December 2023.
- $1,332,504,135 –
Total dollar volume of homes sold, 7.0% more than December 2023.
- 92.2% –
Average close to list price, compared to 91.6% in December 2023.
Travis County
2024
- 13,203 –
Residential homes sold, 3.2% less than 2023.
- $515,000 –
Median price for residential homes, 0.4% less than 2023.
- 21,741 –
New home listings on the market, 4.5% more than 2023.
- 65,636 –
Active home listings on the market, 17.1% more than 2023.
- 13,393 –
Pending sales, 0.8% less than 2023.
- $9,172,819,720 –
Total dollar volume of homes sold, 2.9% less than 2023.
December 2024
- 1,011 –
Residential homes sold, 11.3% more than December 2023.
- $512,500 –
Median price for residential homes, 2.5% more than December 2023.
- 860 –
New home listings on the market, 1.7% less than December 2023.
- 3,893 –
Active home listings on the market, 8.7% more than December 2023.
- 825 –
Pending sales, 1.1% less than December 2023.
- 4.0 –
Months of inventory, 0.9 months more than December 2023.
- $705,912,552 –
Total dollar volume of homes sold, 15.2% more than December 2023.
- 92.2% –
Average close to list price, compared to 90.9% in December 2023.
Williamson County
2024
- 10,360 –
Residential homes sold, 2.0% less than 2023.
- $429,000 –
Median price for residential homes, 1.4% less than 2023.
- 14,110 –
New home listings on the market, 9.2% more than 2023.
- 38,015 –
Active home listings on the market, 9.9% more than 2023.
- 10,545 –
Pending sales, 0.8% more than 2023.
- $5,031,902,867 –
Total dollar volume of homes sold, 3.4% less than 2023.
December 2024
- 806 –
Residential homes sold, 8.2% less than December 2023.
- $425,000 –
Median price for residential homes, 2.2% less than December 2023.
- 693 –
New home listings on the market, 18.3% more than December 2023.
- 2,550 –
Active home listings on the market, 18.3% more than December 2023.
- 709 –
Pending sales, 0.3% more than December 2023.
- 3.2 –
Months of inventory, 0.7 months more than December 2023.
- $388,997,982 –
Total dollar volume of homes sold, 7.9% less than December 2023.
- 92.3% –
Average close to list price, compared to 92.2% in December 2023.
Hays County
2024
- 4,526 –
Residential homes sold, 7.3% more than 2023.
- $380,000 –
Median price for residential homes, 4.8% less than 2023.
- 6,772 –
New home listings on the market, 19.1% more than 2023.
- 20,330 –
Active home listings on the market, 14.4% more than 2023.
- 4,622 –
Pending sales, 10.8% more than 2023.
- $2,200,405,726 –
Total dollar volume of homes sold, 6.3% more than 2023.
December 2024
- 356 –
Residential homes sold, 7.4% more than December 2023.
- $399,990 –
Median price for residential homes, flat compared to December 2023.
- 356 –
New home listings on the market, 13.4% more than December 2023.
- 1,366 –
Active home listings on the market, 4.2% more than December 2023.
- 351 –
Pending sales, 19.0% more than December 2023.
- 3.9 –
Months of inventory, 0.3 months more than December 2023.
- $183,539,494 –
Total dollar volume of homes sold, 14.6% more than December 2023.
- 91.4% –
Average close to list price, compared to 91.5% in December 2023.
Bastrop County
2024
- 1,310 –
Residential homes sold, 7.2% more than 2023.
- $360,000 –
Median price for residential homes, 2.7% less than 2023.
- 2,170 –
New home listings on the market, 18.8% more than 2023.
- 7,259 –
Active home listings on the market, 19.1% more than 2023.
- 1,323 –
Pending sales, 7.9% more than 2023.
- $532,811,486 –
Total dollar volume of homes sold, 5.5% more than 2023.
December 2024
- 108 –
Residential homes sold, 8.8% more than December 2023.
- $380,000 –
Median price for residential homes, 1.3% more than December 2023.
- 120 –
New home listings on the market, 34.8% more than December 2023.
- 565 –
Active home listings on the market, 13.7% more than December 2023.
- 95 – Pending sales,
flat compared to December 2023.
- 5.3 –
Months of inventory, 1.1 months more than December 2023.
- $46,788,483 –
Total dollar volume of homes sold, 17.4% more than December 2023.
- 92.9% –
Average close to list price, compared to 91.1% in December 2023.
Caldwell County
2024
- 473 –
Residential homes sold, 26.1% more than 2023.
- $294,990 –
Median price for residential homes, 1.7% less than 2023.
- 656 –
New home listings on the market, 16.9% more than 2023.
- 1,753 –
Active home listings on the market, 17.7% more than 2023.
- 486 –
Pending sales, 31.4% more than 2023.
- $124,067,144 –
Total dollar volume of homes sold, flat compared to 2023.
December 2024
- 24 – Residential
homes sold, 28.6% less than December 2023.
- $275,000 –
Median price for residential homes, 14.6% less than December 2023.
- 41 – New home
listings on the market, 57.7% more than December 2023.
- 120 –
Active home listings on the market, 30.2% less than December 2023.
- 31 – Pending sales,
63.2% more than December 2023.
- 4.3 –
Months of inventory, 0.3 months more than December 2023.
- $7,265,624 –
Total dollar volume of homes sold, 29.7% less than December 2023.
- 91.7% – Average close to list price, compared to 91.3% in December 2023.

Chris Anderson
Realtor | Chris Anderson | 12 Rivers Realty
or another way